NuttX SensorScope demo with Thingy53
NxScope in Apache NuttX is a universal tool that allows you to capture and transfer time series data to your host machine. In this post, I'll demonstrate its use based on the SensorScope application, which enables the streaming of data from sensors and their subsequent visualization.
For this purpose, the Thingy:53 board from Nordic Semiconductor is used. It has several sensors on board and almost all of them are already supported in NuttX (BME688 is still missing).
SensorScope only works with the new NuttX sensor framework, which is an attempt to standarise the sensor API, making such a tool possible. As of this writing, not all sensor types are supported, but adding new sensor types should be trivial work (look at the code).
Configuration
Thingy:53 is ready to use straight out of the box. In my case, I disconnected everything unnecessary and use a bare PCB as you can see on the photo.
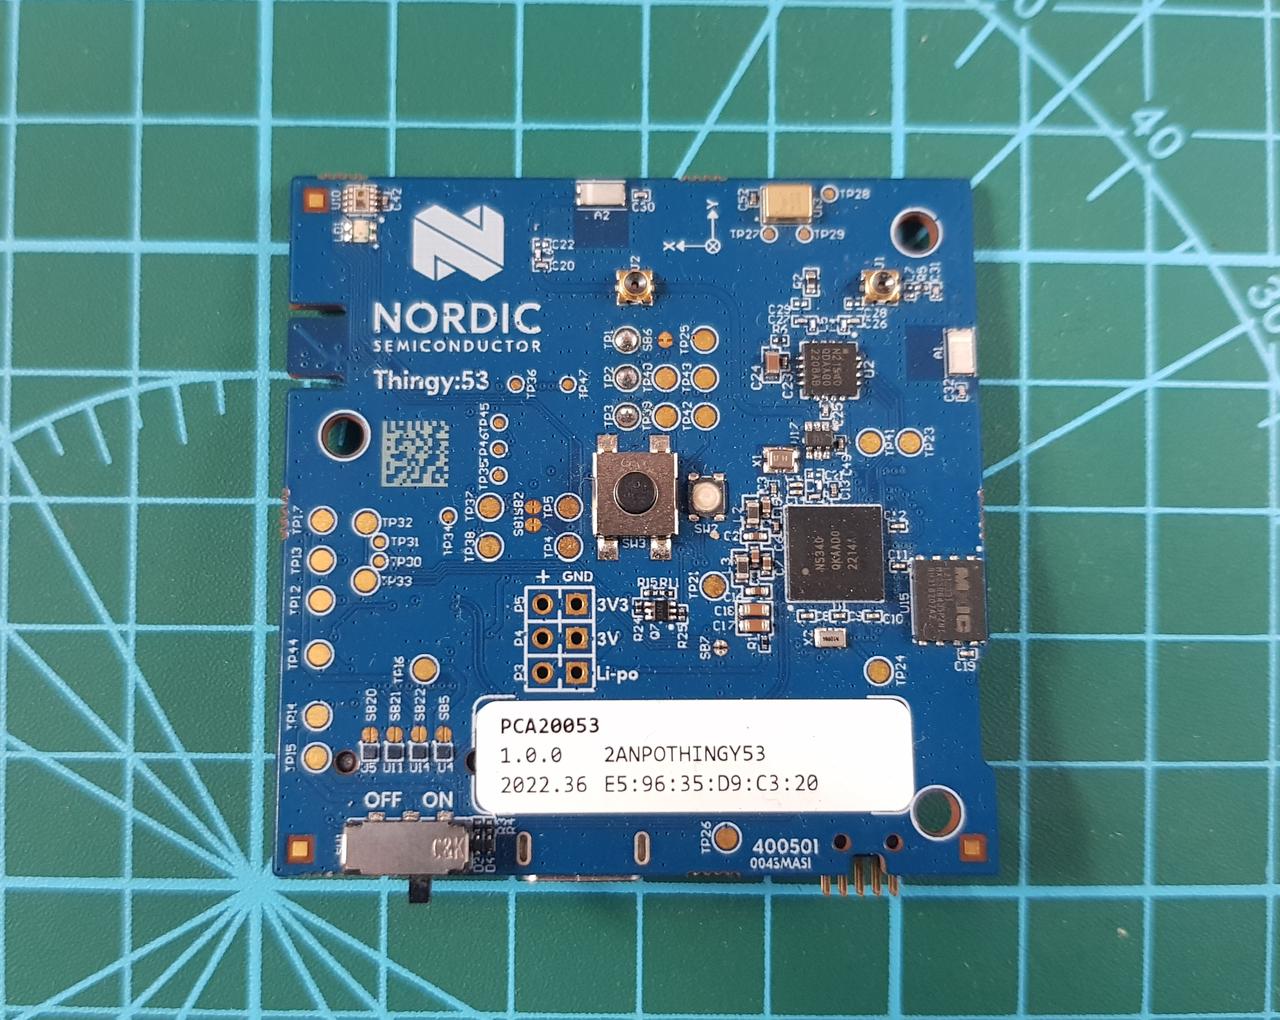
The board works properly when powered from USB. There is no on-board debugger, so we need an external JLink to program the board.
A ready-to-use defconfig for this demo can be found on this branch.
nRF5340 is dual-core SoC, but this demo runs only on the application core, the network core is not used.
Configuration for SensorScope is easy and requires 3 steps:
-
Enable and configure serial interface. In this demo we use CDCACM serial device:
CONFIG_CDCACM=y
CONFIG_CDCACM_RXBUFSIZE=256
CONFIG_CDCACM_TXBUFSIZE=256
-
Enable the NxScope library and SensorScope application:
CONFIG_LOGGING_NXSCOPE=y
CONFIG_SYSTEM_SENSORSCOPE=y
-
Now we configure SensorScope to work with our system. For this demo, we just need set
/dev/ttyACM0as the serial interface:CONFIG_SYSTEM_SENSORSCOPE_CDCACM=y CONFIG_SYSTEM_SENSORSCOPE_FETCH_INTERVAL=100000 CONFIG_SYSTEM_SENSORSCOPE_SERIAL_PATH="/dev/ttyACM0" CONFIG_SYSTEM_SENSORSCOPE_STREAMBUF_LEN=2048
SensorScope is configured, now we enable the sensor framework and all the sensors supported by our board:
CONFIG_SENSORS=y
CONFIG_SENSORS_ADXL362=y
CONFIG_SENSORS_BH1749NUC=y
CONFIG_SENSORS_BH1749NUC_UORB=y
CONFIG_SENSORS_BMI270=y
CONFIG_SENSORS_BMI270_UORB=y
CONFIG_SENSORS_BMM150=y
Sensors are automatically detected by the appliation, and with a standarized interface, each sensor returns data of a known type and scale.
At this moment SensorScope is designed to support sensor FETCH interface,
so make sure that SENSORS_{sensor_name}_POLL options are disabled.
SensorScope is the only application we run so INIT_ENTRYPOINT must be configured properly:
CONFIG_INIT_ENTRYPOINT="sensorscope_main"
Configuration is ready, we can compile it and flash binary on the application core in nRF5340.
Results
To capture and parse the data, we use nxscli tool with nxscli-mpl plugin and PlotJuggler.
First, let's check if we can communicate with the SensorScope correctly,
so let's get information about the connected device. In my case the device
is available under /dev/ttyACM0:
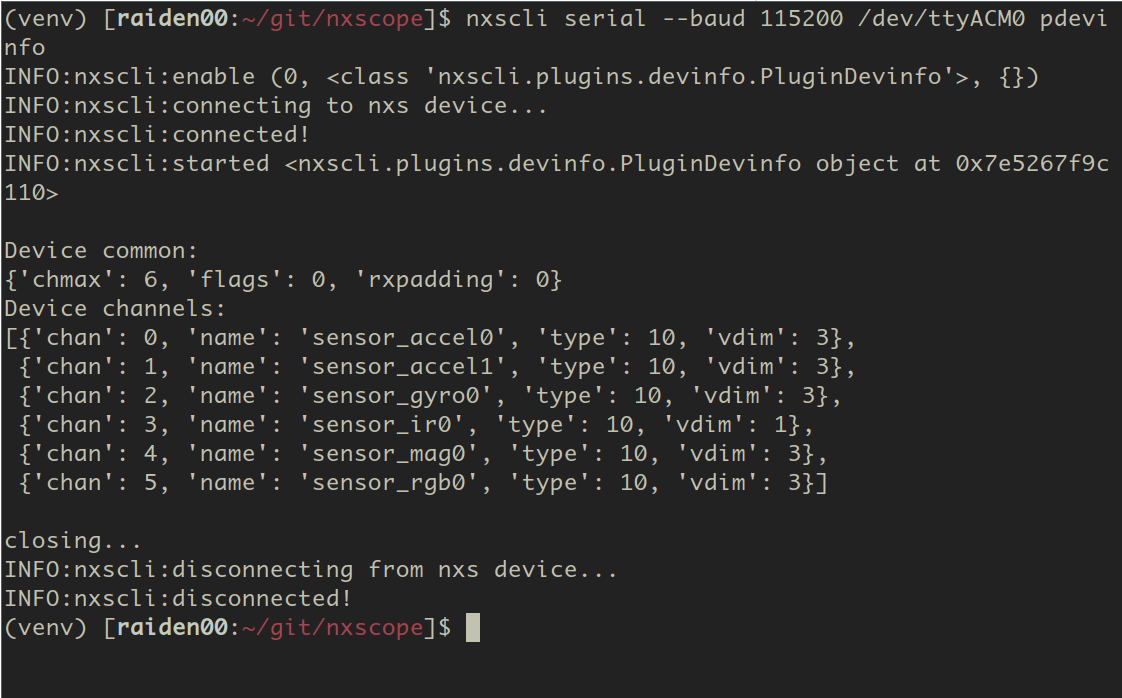
nxscli serial --baud 115200 /dev/ttyACM0 pdevinfo
If everything works properly, we'll see the available sensor channels:
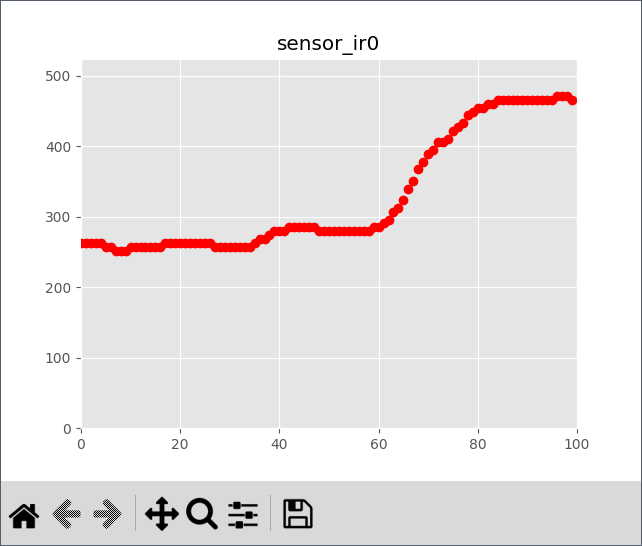
To plot accel0 data with Matplotlib plugin use:
nxscli serial --baud 115200 /dev/ttyACM0 chan 0 pani2 100
Unfortunately, real-time plots in Matplotlib are quite slow, so if we want to visualize larger amounts of data, it's better to use PlotJuggler at the moment. Detailed instructions on how to do this can be found in my previous post.
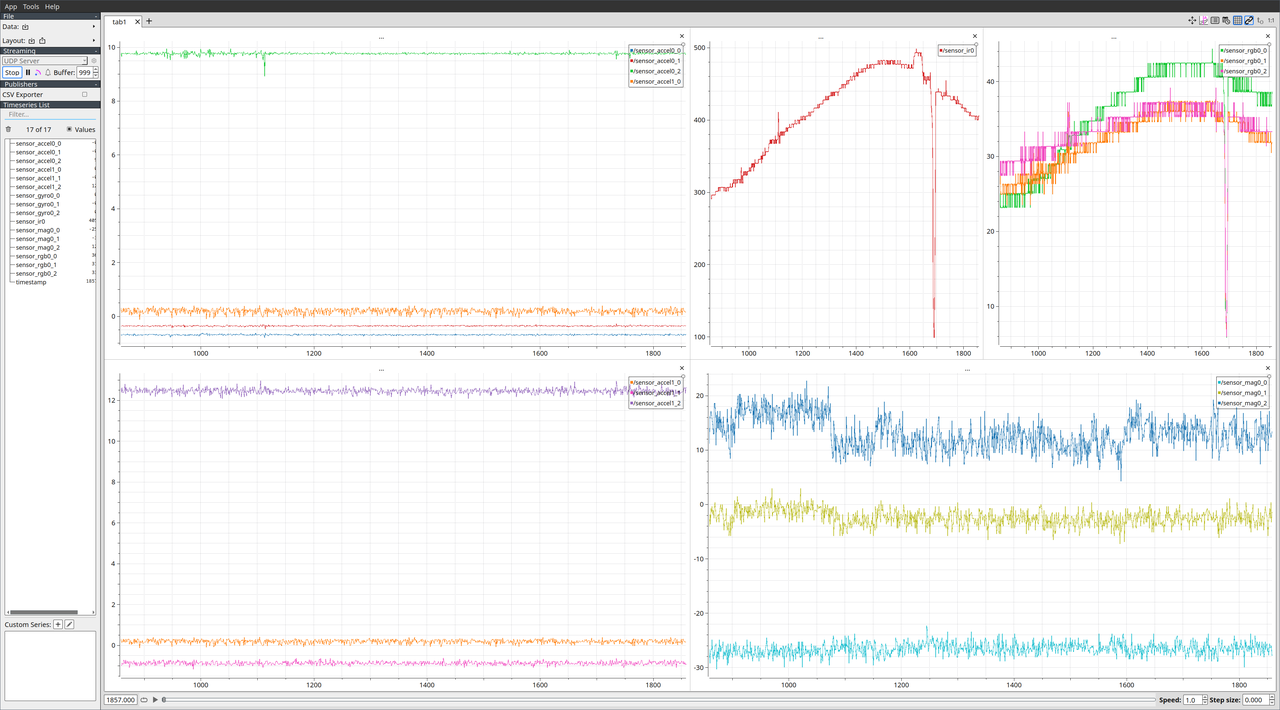
To pass all available channels to PlotJuggler just use chan all argument:
nxscli serial --baud 115200 /dev/ttyACM0 chan all pudp 0
Below is an example of all availabe sensor data captured in real-time:
Further improvements
A tool like this can be really helpful when implementing new sensors, as it allows us to verify whether everything is working properly. Data in the form of a plot is much easier to analyze than data printed in the console. It can help evaluate and calibrate sensors to better fit our application. And most importantly, real-time data plots are always fun to observe :)
A few improvements to this setup that come to my mind right now are:
Support the
POLLinterface availalbe in the sensors framework (buffered data).Control sensor parameters in run-time, so we can adjust configurations like capture interval, bandwidth, and scale. The NxScope library is prepared to support protocol extensions and user-defined requests.
Integrate PyQtGraph, which should be much more effective for real-time plotting than Matplotlib.
Implement statistics on the nxscli side and add some useful tools like a histogram.
Support the fixed-point float data type in NuttX sensor drivers, so we can use this tool effectively with architectures that don't have an FPU.
Finally, port more sensors to the new NuttX sensor framework, since a standarized sensor API is a key issue for NuttX.
Comments